Sometimes you may want to analyse and view trends in your data without creating an entire chart. Sparklines are miniature charts that fit into a single cell.
A Sparkline is a tiny chart in a worksheet cell that provides a visual representation of data. Use sparklines to show trends in a series of values, such as seasonal increases or decreases, economic cycles, or to highlight maximum and minimum values. Position a Sparkline near its data for greatest impact.
Sparkline can display a trend based on adjacent data in a clear and compact graphical representation. Although it’s not mandatory for a Sparkline cell to be directly next to its underlying data, it is a good practice.
We can quickly see the relationship between a Sparkline and its underlying data, and when your data changes you can see the change in the Sparkline immediately. In addition to creating a single Sparkline for a row or column of data, you can create several sparklines at the same time by selecting multiple cells that correspond to underlying data,
Sparklines have certain advantages over charts. For example, let’s say you have 1,000 rows of data. A traditional chart would have 1,000 data series to represent all of the rows, making relevant data difficult to find. But if you placed a Sparkline on each row, it will be right next to its source data, making it easy to see relationships and trends for multiple data series at the same time.
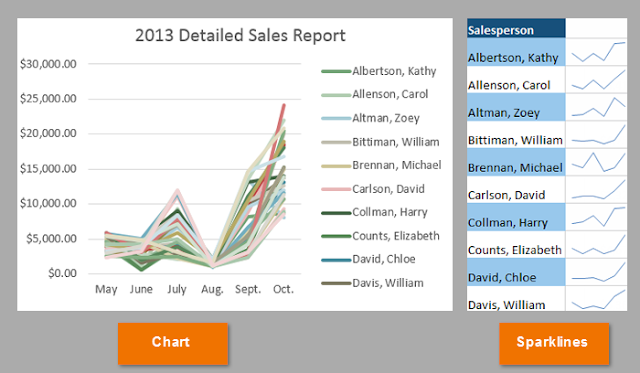
In the image below, the chart is extremely cluttered and difficult to follow, but the sparklines allow you to clearly follow each salesperson’s data.

TYPES OF SPARKLINES
There are three different types of sparklines:
- Line that represents the relative value of the selected worksheet data
- Column where the selected worksheet data is represented by tiny columns
- Win/Loss where the selected worksheet data appears as a win/loss chart; wins are represented by blue squares that appear above red squares (representing the losses)
CREATE A SPARKLINE
- Select an empty cell or group of empty cells in which you want to insert one or more sparklines.
- On the Insert tab, in the Sparklines group, click the type of Sparkline that you want to create: Line, Column, or Win/Loss.
- Select the range of the cells that contain the data on which you want to base the Sparklines.
The Sparkline will appear in the specified cell.