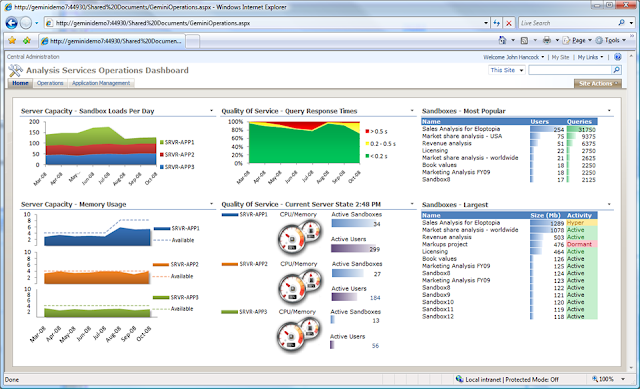
PowerPivot is an add-in for Microsoft Excel that enables you to import millions of rows of data from multiple data sources into a single Excel workbook, create relationships between heterogeneous data, create calculated columns and measures using formulas, build PivotTables and PivotCharts, and then further analyze the data so that you can make timely business decisions without requiring IT assistance.

Power Pivot is a feature of Microsoft Excel. It is available as an add-in in Excel 2010 and 2013, and is included natively in Excel 2016. PowerPivot extends a local instance of Microsoft Analysis Services Tabular that is embedded directly into an Excel Workbook. This allows a user to build a ROLAP model in PowerPivot, and use pivot tables to explore the model once it is built. This allows Excel to act as a Self-Service BI platform, implementing professional expression languages to query the model and calculate advanced measures.
Prior to the release of Power Pivot, Microsoft relied heavily on SQL Server Analysis Services as the engine for its Business Intelligence suite. PowerPivot complements the SQL Server core BI components under the vision of one Business Intelligence Semantic Model (BISM), which aims to integrate on-disk multidimensional analytics previously known as Unified Dimensional Model (UDM), with a more flexible, in-memory “tabular” model.
Reference:
https://msdn.microsoft.com/en-us/library/gg413497(v=sql.110).aspx