People Graph is a cool app for Office that transforms your cold data to vivid pictures. The new release includes eight new shapes, simplified data binding, and added new notifications and error handling.
Most people are not aware of the nice tool named People Graph that become available with Excel 2013 and later versions. It is very easy to create a people graph with Excel. It looks really nice and professional. But it is a one dimensional chart that can only show one column of data.
You can get this app from store link located under Insert Tab.
Install the People Graph app for Office
- Sign in to Office 2013 with your Microsoft Account
- Open Excel 2013 and choose INSERT > Apps for Office.
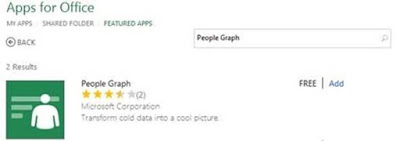
3. Choose FEATURED APPS, search “People Graph”, and then choose Add.
- Choose Trust It.
Chart types
| People Graph app includes three chart types. |
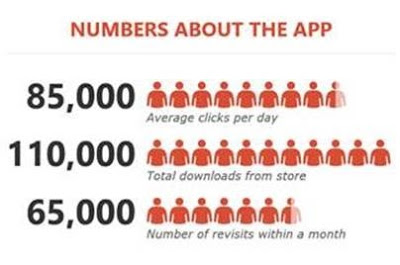
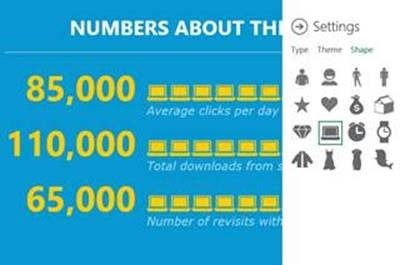
Chart themes
| For each chart type, there are seven themes to choose. |

Chart themes
| For each chart type, there are seven themes to choose. |
Here is a step by step guide for creating a People Graph:
- Have your data arranged in two columns.
- You can find People Graph under insert tab, inside add-ins group.
- Click on the button and a default window appears:
Notice two buttons on upper right corner of the screen. The one on the left (looks like a table) is Data button and the one on the right (cog) is Settings button. When you press Data button, a menu will slide in from right.
- Input graph title inside the text box below the green button and press “Select your data” button to select your data.
- You will receive an information note regarding your selection based on the charts limitations. Press Create button and your People Graph will be created with default styling options.
- Now you can change the formatting by Click on the Settings button (Cog on the upper right corner).