Data Tables
Instead of entering formulas and variables individually, to compare results, you can set up a Data Table, with one or two variables. Data Tables are one of Excel’s “What If Analysis” features
With a Data Table in Excel, you can easily vary one or two inputs and perform What-if analysis. A Data Table is a range of cells in which you can change values in some of the cells and come up with different answers to a problem.
There are two types of Data Tables
- One-variable Data Tables
- Two-variable Data Tables
One-variable Data Tables
A one-variable Data Table can be used if you want to see how different values of one variable in one or more formulas will change the results of those formulas. In other words, with a one-variable Data Table, you can determine how changing one input changes any number of outputs. You will understand this with the help of an example.
Create a Data Table With 1 Variable
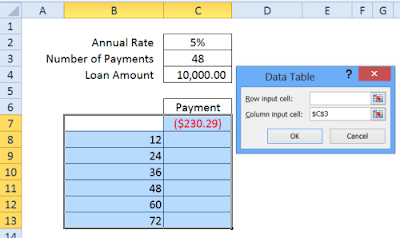
In this example, you will build a data table that shows the monthly payments for loan terms ranging from 1 to 6 years. The number of payments will range from 12 to 72.
NOTE: The Input cells have to be on the same sheet as the data table.
The loan information is in cells C2:C4, with the number of payments in cell C3.
To set up the data table:
- In cells B8:B13, type the number of payments for loans terms of 1 to 6 years
- In cell C7, enter a PMT function, referring to the loan information cells: =PMT(C2/12,C3,C4)
- Select cells B7:C13 – the heading cells and the cells for the results
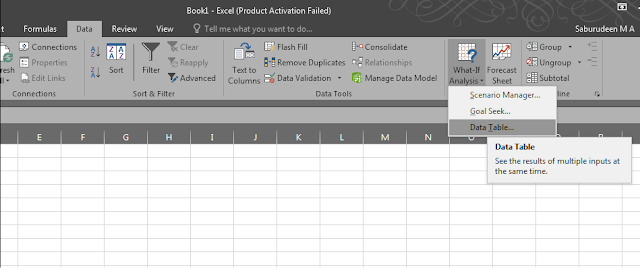
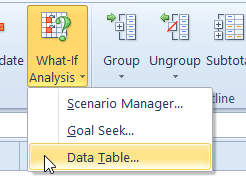
- On the Ribbon’s Data tab, in the Data Tools group, click What-If Analysis, and then click Data Table.
5. Click in the Column Input cell box, and then click on cell C3, which contains the variable for the number of payments.
- Click OK, to close the dialog box.
- Select the cells with the monthly payments, and format as Currency. In the screen shot below, the format is Currency, with negative numbers bracketed and in red.
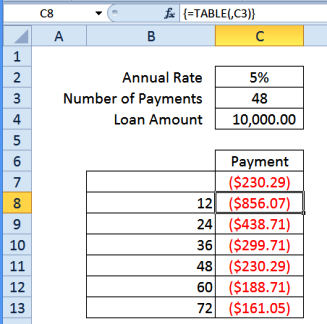
- Click on one of the calculated monthly payment cells, and the formula bar shows that the cell contains a TABLE function, with cell C3 as the second argument. The curly brackets at the start and end of the formula indicate that this is an array formula
Two-variable Data Tables
A two-variable Data Table can be used if you want to see how different values of two variables in a formula will change the results of that formula. In other words, with a twovariable Data Table, you can determine how changing two inputs changes a single output. You will understand this with the help of an example.
Create a Data Table With 2 Variables
In this example, you will build a data table with 2 variables. It will show the monthly payments for loan terms ranging from 1 to 6 years, and interest rates from 2% to 6%.
NOTE: The Input cells have to be on the same sheet as the data table.
The loan information is in cells C2:C4, with the interest rate in C2, and the number of payments in cell C3.
To set up the data table:
- In cells B8:B13, type the number of payments for loans terms of 1 to 6 years
- In cells C7:G7, enter the interest rates between 2% and 6%
- In cell B7, enter a PMT function, referring to the loan information cells: =PMT(C2/12,C3,C4)
- Select cells B7:G13 – the heading cells and the cells for the results
- On the Ribbon’s Data tab, in the Data Tools group, click What-If Analysis, and then click Data Table.
- Click in the Row Input cell box, and then click on cell C2, which contains the variable for the interest rate.
- Click in the Column Input cell box, and then click on cell C3, which contains the variable for the number of payments.
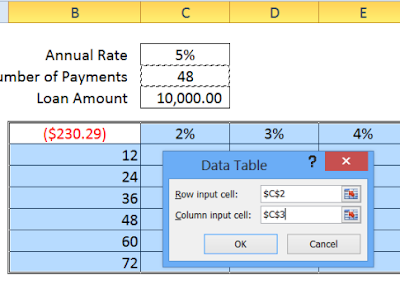
- Click OK, to close the dialog box.
- Select the cells with the monthly payments, and format as Currency. In the screen shot below, the format is Currency, with negative numbers bracketed and in red.
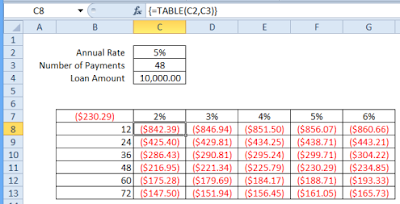
10. Click on one of the calculated monthly payment cells, and the formula bar shows that the cell contains a TABLE function, with cell C2 as the first argument, and C3 as the second argument. The curly brackets at the start and end of the formula indicate that this is an array function.